Insights
Introduction
The monitoring pages of the neomia Pulse Dashboard allow the administrator to get insights on how the neomia Pulse MFA is used.
The main pages are:
- Home — the current security posture of the organization.
- Authentications — the authentication timeline with full per-authentication details and forensics.
- Users — user and account management.
- Groups — groups inferred from authentication tags and the policy applied to each.
- Organization — organization-wide statistics.
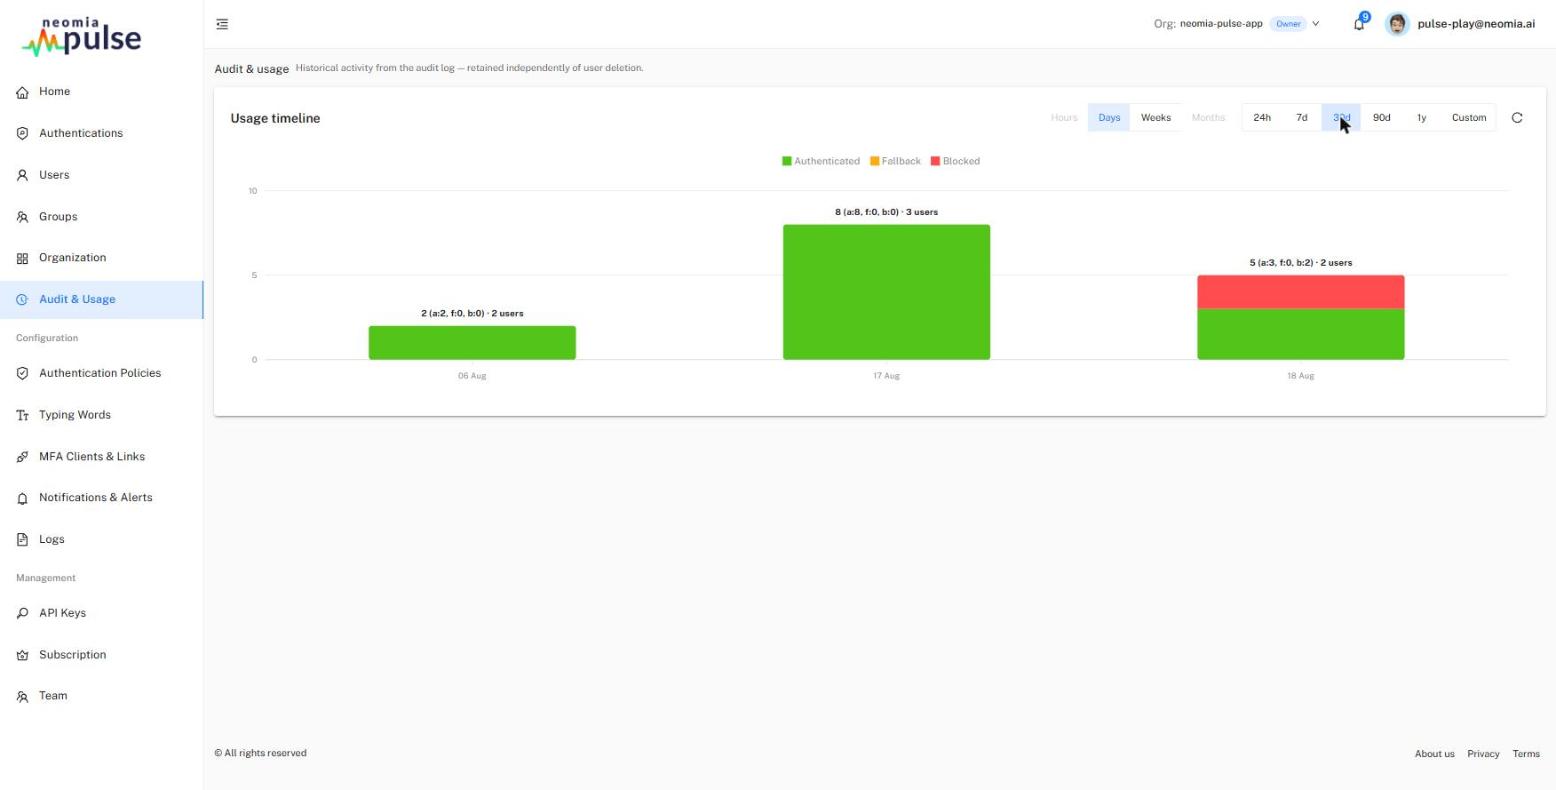
- Audit & Usage — historical activity from the audit log.
Home
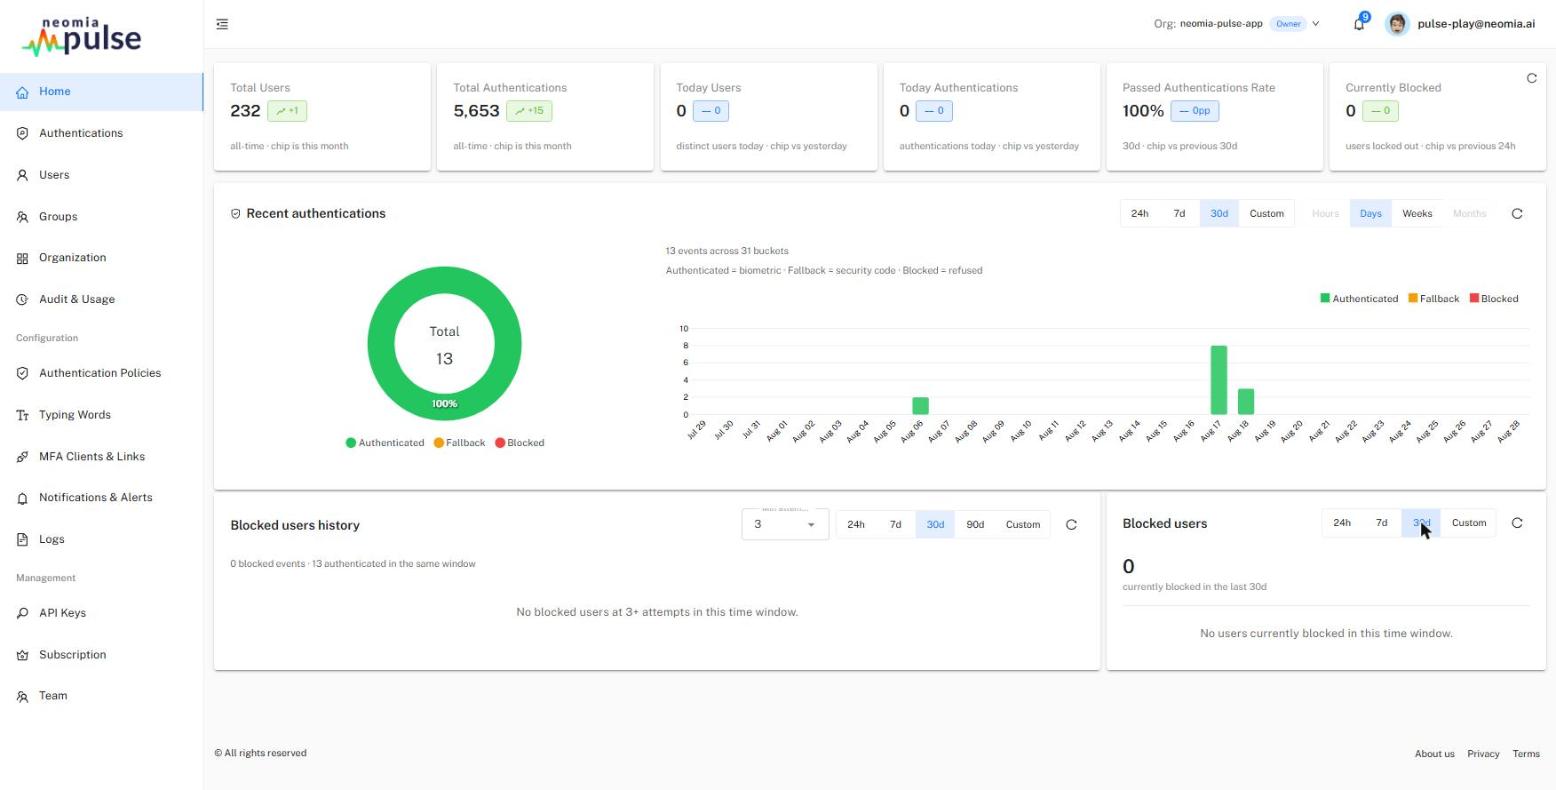
The Home page shows the current state of the organization (historical timelines are on the Audit & Usage page).
Key figures — six cards, each with its value and a trend chip:
- Total Users and Total Authentications (all-time, chip shows this month),
- Today Users and Today Authentications (chip compares with yesterday),
- Passed Authentications Rate (last 30 days, chip vs the previous 30 days),
- Currently Blocked — users currently locked out (green when zero, red when the situation worsened over the last 24 hours).
Recent authentications — a donut of Authenticated / Fallback / Blocked outcomes next to the authentication trend, with a period selector (24h / 7d / 30d) and an aggregation selector (hours / days / weeks / months).
Blocked users and Blocked users history — the current lock-out list and its evolution.
Authentications
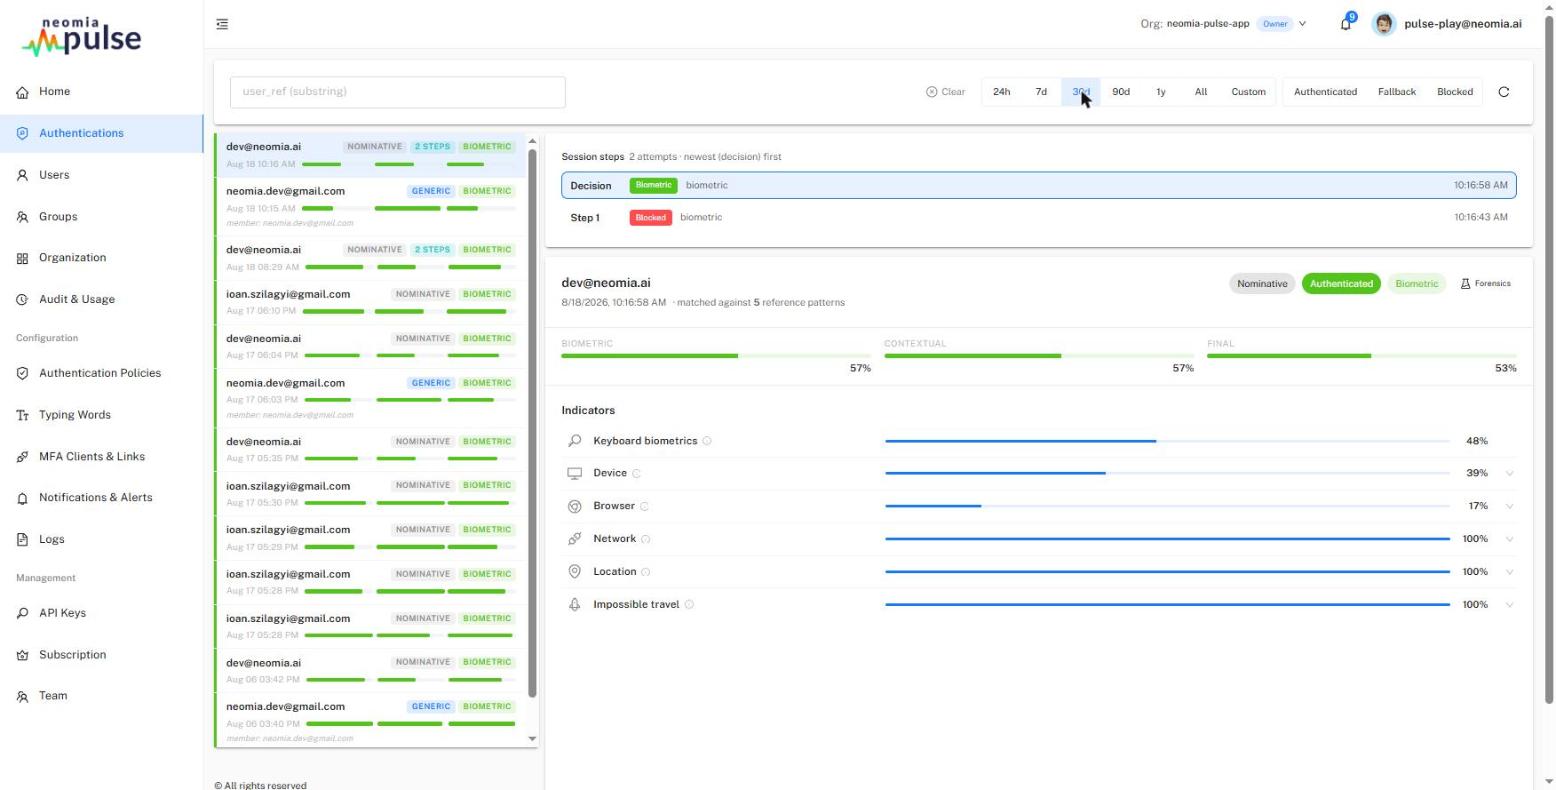
The Authentications page is a two-pane view: a scrollable timeline of authentications on the left, the details of the selected authentication on the right.
Filters: a user-reference search box with live suggestions, a period selector (24h / 7d / 30d / 90d / 1y / all, or a custom date range) and an outcome filter (Authenticated / Fallback / Blocked). Filters are reflected in the page URL, so a filtered view can be bookmarked or shared.
Sessions: attempts made during the same sign-in session are grouped into a single row, showing the final decision and the number of steps. Selecting a row exposes the individual steps (e.g. failed biometric attempts followed by a security-code fallback), each with its outcome, method and time.
Authentication details
For the selected authentication the detail card shows:
- the user reference (with the display name, if configured), and for shared (generic) accounts the member who actually authenticated;
- the account type (Nominative / Generic), the outcome (Authenticated / Fallback / Blocked) and the method (Biometric / PIN fallback);
- the score strip: the Biometric, Contextual and Final scores. For a security-code login, biometric scores are not applicable and the card says so.
Indicators
Each authentication carries one expandable row per indicator, in the canonical order:
- Keyboard biometrics (typing biometrics evaluation) — the primary indicator,
- Device (device characteristics, compared to the reference patterns),
- Browser (brand and version, compared to the reference patterns),
- Network (IP address, ISP, fraud score — compared to recent logins),
- Location (city, region, country — compared to recent logins),
- Impossible travel (computed from the distance and time between the previous and current login locations; above 1,000 km/h the login is flagged as impossible travel).
Expanding an indicator shows its signals with their measured values, reference values and history.
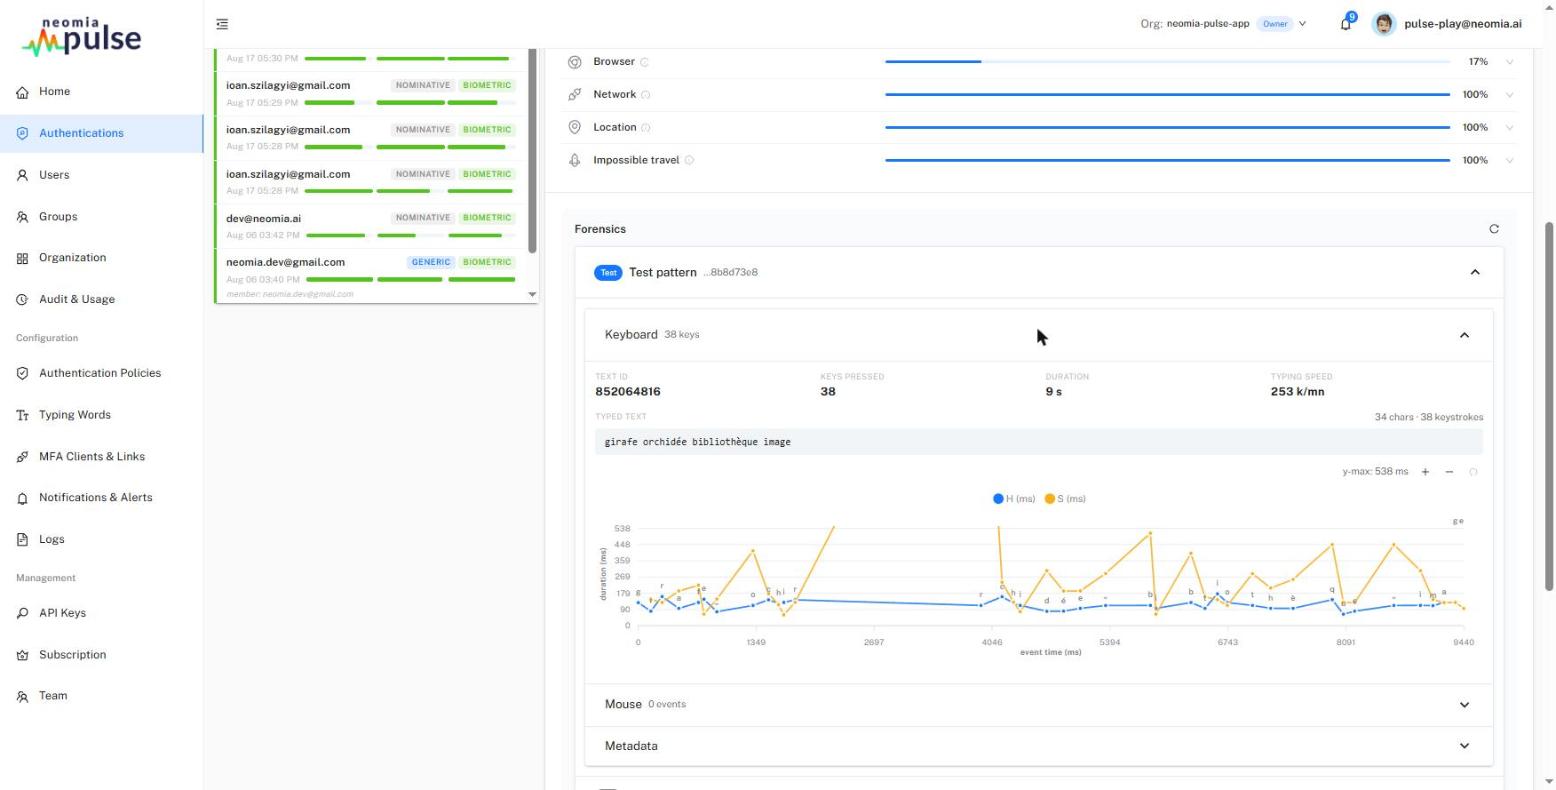
Forensics
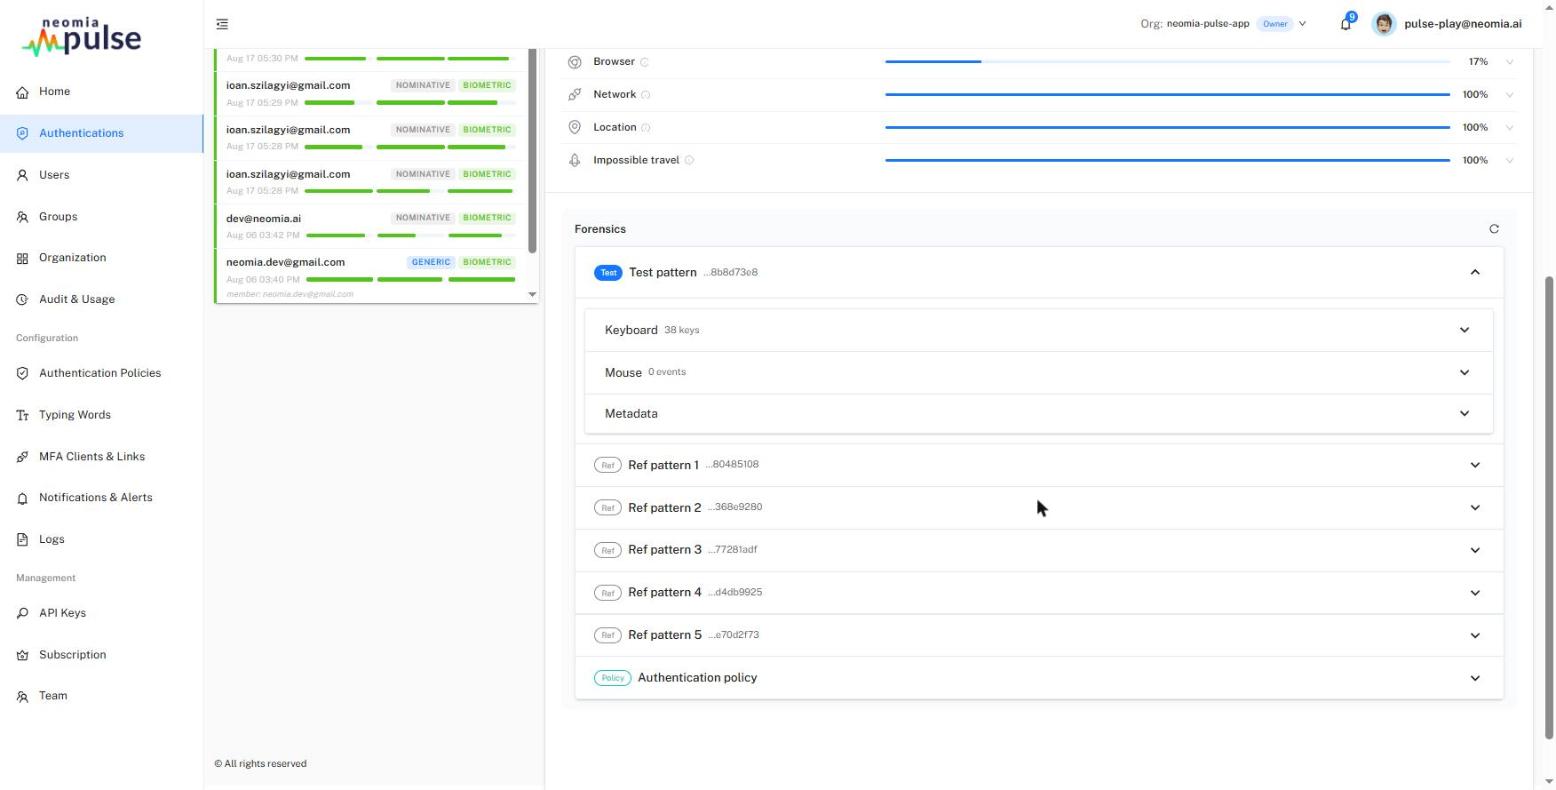
The Forensics toggle (also available by shift-clicking a timeline row) opens the pattern viewer:
- the test pattern and each reference pattern used in the comparison, with keyboard and mouse plots, tags and contextual metadata;
- the authentication policy that was applied, rendered as a key/value view;
- pattern identifiers can be copied with a click; shift-clicking one opens the raw pattern JSON (admins and owners only — analysts do not have access to raw forensics data).
Users
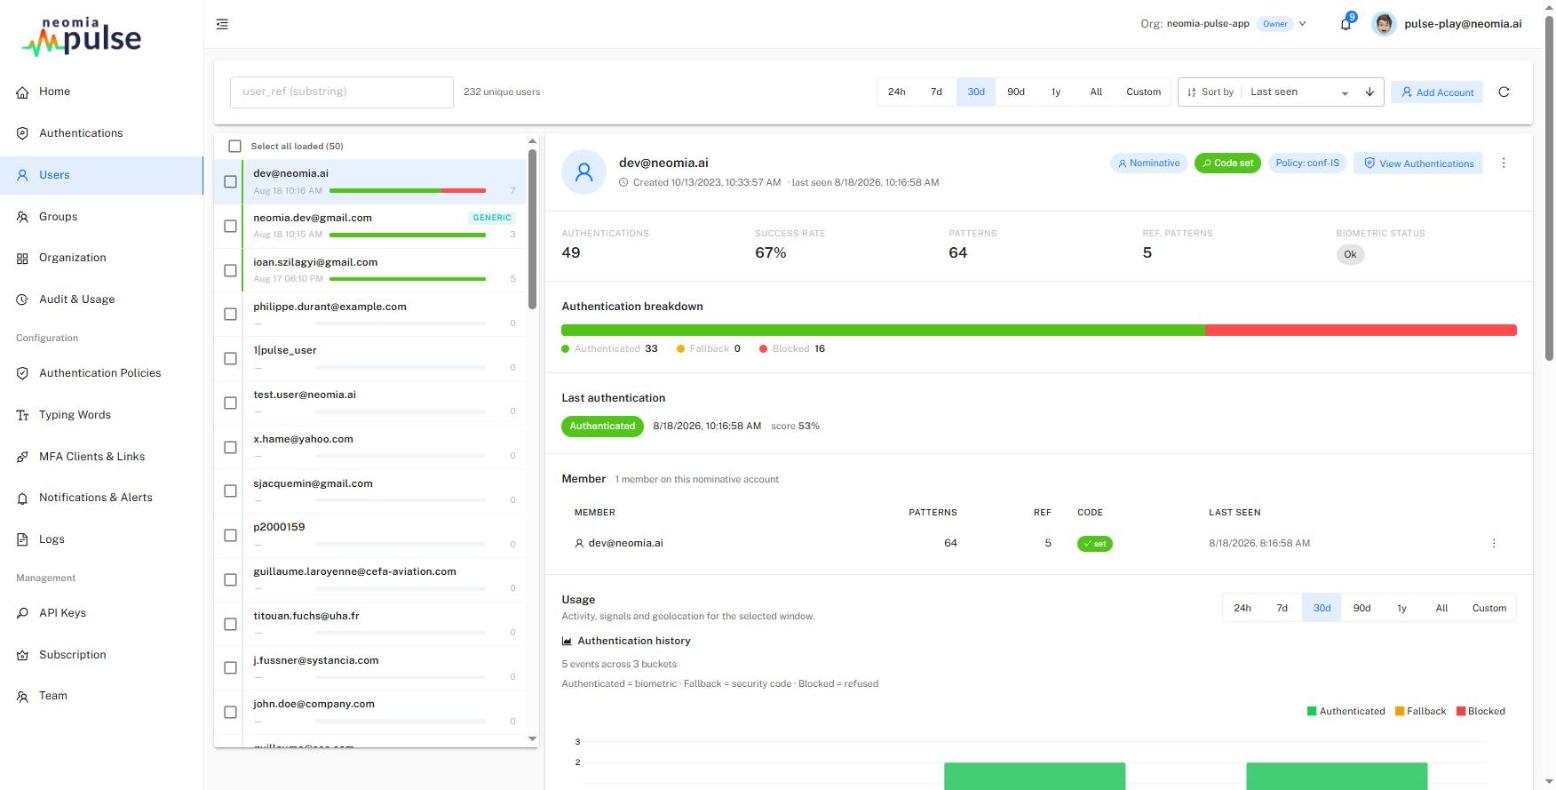
The Users page is a two-pane view: the account list on the left, the selected account's details on the right.
Filters and sorting: a user-reference search with suggestions, a period selector, and sorting by last seen, last score, user reference, authenticated/failed counts, authentication rate, patterns, reference patterns or biometric status.
Each row shows the user reference, a Generic badge for shared accounts, its groups, the display name (when configured), the last-seen date and an inline authenticated/challenged/blocked bar.
Accounts: nominative and generic
neomia Pulse distinguishes two account types:
- a nominative account belongs to a single person — the member is the account;
- a generic (shared) account is used by several people (e.g. a reception desk): each person is a member of the account, with their own biometric profile and security code. Member references must be unique within an account.
Adding a second member to a nominative account promotes it to generic — the dashboard asks for explicit confirmation (Promote and add).
Account details
The detail card shows the account creation and last-seen dates, its type, its groups, whether a security code is set, and the authentication policy that applies to it (with a system annotation when no organization-level policy matched). It also gives per-account KPIs (authentications, success rate, patterns, reference patterns, biometric status), the authentication breakdown and the last authentication.
The Members section lists each member with per-member actions:
- Update biometric profile — ask the member to add more biometric samples on the next sign-in;
- Reset biometric profile — the member re-enrolls on the next sign-in;
- Rotate security code — generates a new code, shown once for the administrator to relay;
- Set display language — per-member override of the sign-in widget language;
- Cancel pending action and Remove member.
For generic accounts, a member resolution toggle controls the sign-in experience: Ask prompts the person for their member reference without revealing the roster (default); List shows the account's members at sign-in.
The Usage section shows the account's authentication history, connection patterns (hour of day, day of week), a geolocation map and the aggregated signal values.
Creating accounts
Add account creates a nominative or generic account, optionally with a first member, choosing the enrollment mode: next connection (the user enrolls at their next sign-in) or an enrollment link to distribute. A security code can be generated at creation — it is shown once, together with the link.
Bulk actions
Selecting several rows opens the batch bar:
- Reset biometrics — queue a biometric reset for the selected users (deferred, no links to distribute);
- Update profile — ask the selected users to add more biometric samples on their next sign-in;
- Rotate code — generate fresh security codes; the dashboard downloads a one-time CSV (
user_ref, member_ref, security_code) to hand out — codes are not shown again; - Delete — irreversible; the confirmation dialog lists every selected account and requires typing the number of accounts to enable the deletion.
The result of a batch reports how many operations succeeded and failed.
Groups
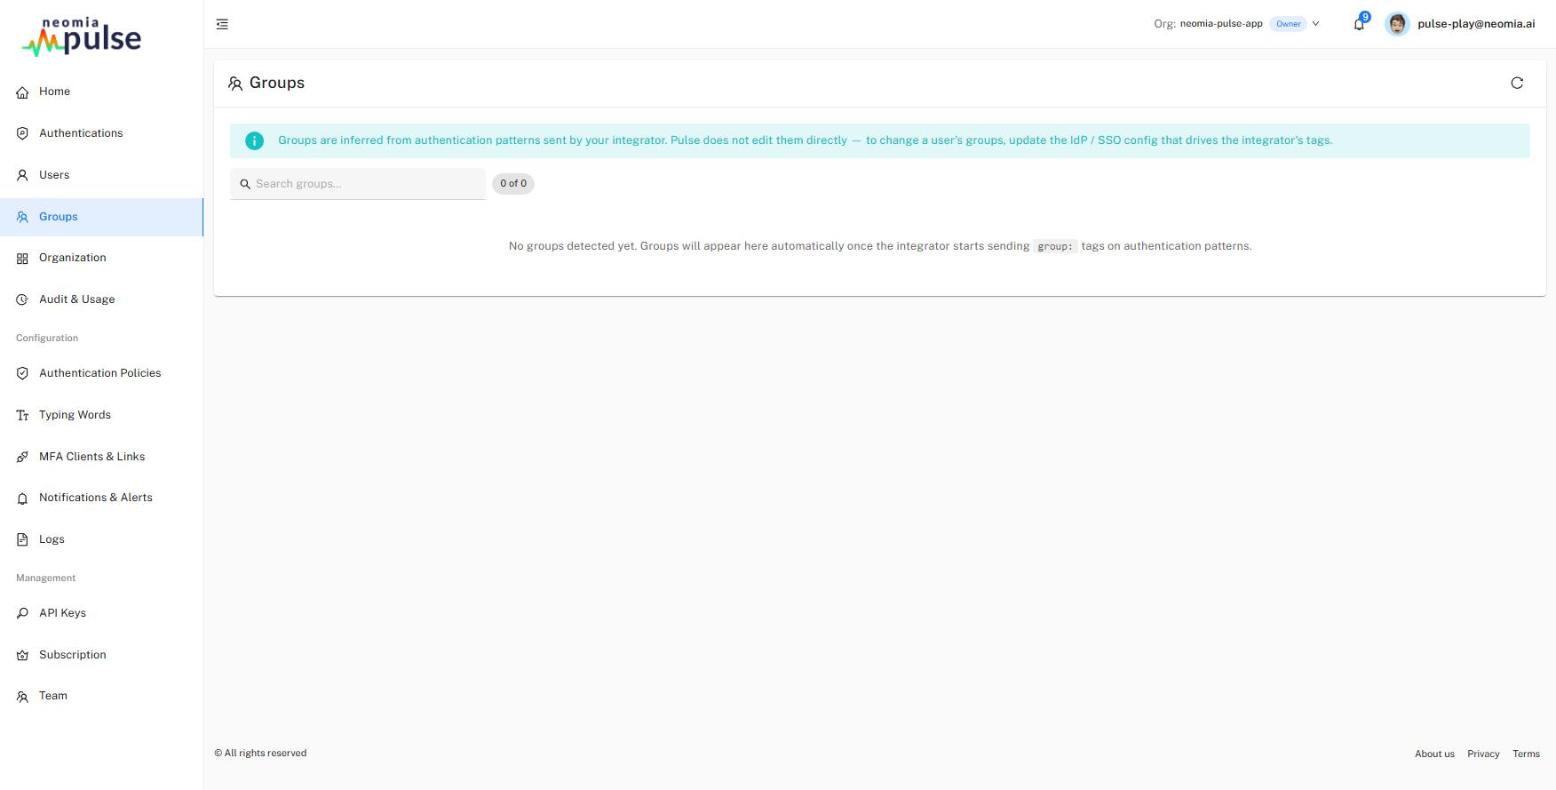
Groups are inferred from the authentication tags sent by your integration (group:<name> tags on patterns) — Pulse does not edit them directly. To change a user's groups, update the IdP / SSO configuration that drives the integration's tags.
The page lists each group with its member count, the policy applied to it (resolved through the policy tiers — see Configuration → Authentication Policies) and its status. View members jumps to the Users page filtered on the group.
Organization
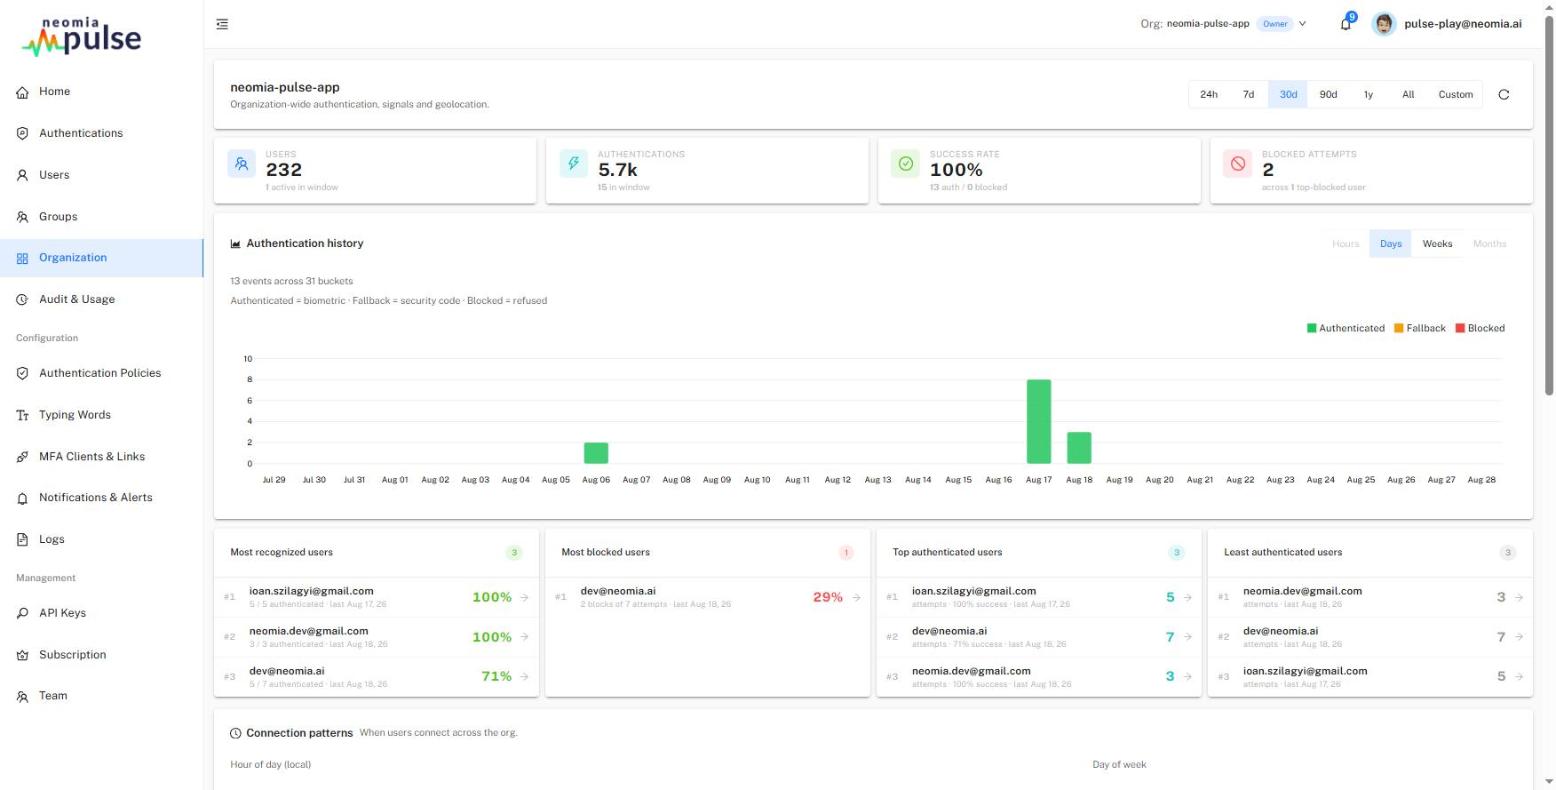
The Organization page is the organization-wide equivalent of the per-account usage view, with a period selector:
- organization KPIs, authentication history (with its own aggregation granularity),
- four leaderboards: most recognized users, most blocked users, top authenticated users, least authenticated users,
- connection patterns, the geolocation map and the aggregated signals for the whole organization.
Audit & Usage
Historical activity from the audit log — an append-only store retained independently of user deletion. Use it to review past usage even after accounts have been removed. Data exports are available under Configuration → Logs.